SITE USAGE - MAY 2011
These charts, which are generated by the server provider, indicated how much the site is being used, the number of hits the site receives each month, the amount of material that is view and much more information.
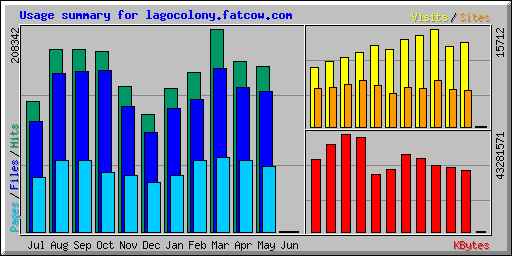
The first chart, the bar graft shows the number of hits in green, the number of files viewed in blue and the number of pages viewed in light blue. The yellow and orange bars indicated the sites and the visitors. The red bars are the amount of information, in KBytes that were viewed. This chart covers the past year, 2009/2010.
As new charts are provided by the server company who hostess the site I will post them on this page

This next chart provides the same information in numbers.
|
|
||||||||||
|
Summary by Month |
||||||||||
|
|
|
|
|
|
|
|
|
|
|
|
|
Month |
Daily Avg |
Monthly Totals |
||||||||
|
Hits |
Files |
Pages |
Visits |
Sites |
KBytes |
Visits |
Pages |
Files |
Hits |
|
|
|
|
|
|
|
|
|
|
|
|
|
|
185 |
156 |
112 |
26 |
36 |
24718 |
26 |
112 |
156 |
185 |
|
|
5465 |
4651 |
2182 |
436 |
5864 |
27198517 |
13529 |
67661 |
144189 |
169437 |
|
|
5825 |
4955 |
2435 |
428 |
6063 |
28370266 |
12841 |
73059 |
148662 |
174754 |
|
|
6720 |
5402 |
2463 |
506 |
7417 |
29439302 |
15712 |
76377 |
167483 |
208342 |
|
|
5858 |
4839 |
2636 |
521 |
6231 |
32612673 |
14601 |
73830 |
135499 |
164027 |
|
|
4763 |
4085 |
1859 |
454 |
6322 |
34317420 |
14080 |
57658 |
126657 |
147678 |
|
|
3875 |
3294 |
1641 |
401 |
5344 |
27539411 |
12440 |
50901 |
102137 |
120132 |
|
|
4987 |
4307 |
1929 |
435 |
6639 |
25560495 |
13050 |
57891 |
129232 |
149617 |
|
|
5991 |
5331 |
1984 |
383 |
7516 |
41618214 |
11875 |
61521 |
165262 |
185743 |
|
|
6258 |
5478 |
2448 |
373 |
6870 |
43281571 |
11197 |
73447 |
164341 |
187751 |
|
|
6043 |
5241 |
2356 |
339 |
6272 |
38672802 |
10517 |
73047 |
162485 |
187337 |
|
|
4326 |
3666 |
1803 |
306 |
6199 |
32024868 |
9516 |
55906 |
113657 |
134108 |
|
|
|
|
|
|
|
|
|
|
|
|
|
|
Totals |
360660257 |
139384 |
721410 |
1559760 |
1829111 |
|||||
|
|
|
|
|
|
|
|
|
|
|
|